This report is made possible by the California Real Estate Brokers, Inc. (C.R.E.B.)
![]()
Download Current and Past Monthly Market Report PDF
![]()


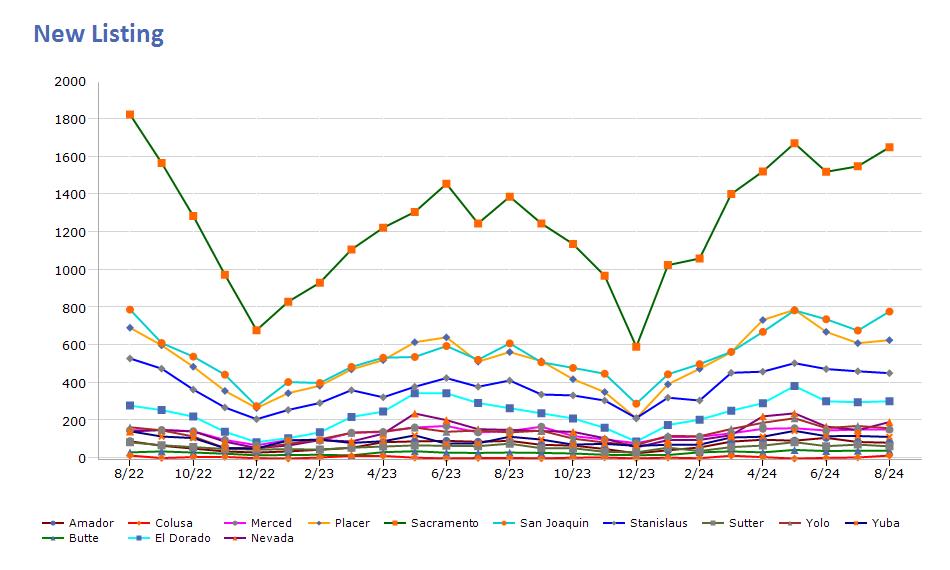
New Listing By County
Feb 2025 vs Jan 2025
| Amador | 60 | 70 | -14% |  |
| Butte | 44 | 44 | 0% | |
| Calaveras | 73 | 73 | 0% | |
| Colusa | 9 | 17 | -47% | |
| El Dorado | 288 | 265 | 9% | |
| Merced | 121 | 151 | -20% | |
| Nevada | 143 | 120 | 19% | |
| Placer | 602 | 548 | 10% | |
| Sacramento | 1280 | 1269 | 1% | |
| San Joaquin | 655 | 690 | -5% | |
| Stanislaus | 421 | 459 | -8% | |
| Sutter | 63 | 66 | -5% | |
| Yolo | 162 | 136 | 19% | |
| Yuba | 114 | 118 | -3% | |
Pended By County
Feb 2025 vs Jan 2025
| Amador | 32 | 47 | -32% | |
| Butte | 27 | 15 | 80% | |
| Calaveras | 36 | 49 | -27% | |
| Colusa | 12 | 7 | 71% | |
| El Dorado | 174 | 149 | 17% | |
| Merced | 89 | 87 | 2% | |
| Nevada | 100 | 71 | 41% | |
| Placer | 410 | 351 | 17% | |
| Sacramento | 922 | 834 | 11% | |
| San Joaquin | 428 | 403 | 6% | |
| Stanislaus | 352 | 250 | 41% | |
| Sutter | 31 | 58 | -47% | |
| Yolo | 116 | 94 | 23% | |
| Yuba | 95 | 69 | 38% | |
Sold By County
Feb 2025 vs Jan 2025
| Amador | 41 | 31 | 32% | |
| Butte | 20 | 14 | 43% | |
| Calaveras | 41 | 40 | 2% | |
| Colusa | 4 | 11 | -64% | |
| El Dorado | 126 | 113 | 12% | |
| Merced | 66 | 82 | -20% | |
| Nevada | 66 | 72 | -8% | |
| Placer | 314 | 271 | 16% | |
| Sacramento | 745 | 762 | -2% | |
| San Joaquin | 345 | 360 | -4% | |
| Stanislaus | 203 | 216 | -6% | |
| Sutter | 42 | 38 | 11% | |
| Yolo | 98 | 62 | 58% | |
| Yuba | 69 | 52 | 33% | |
 Powered by
 Powered by
 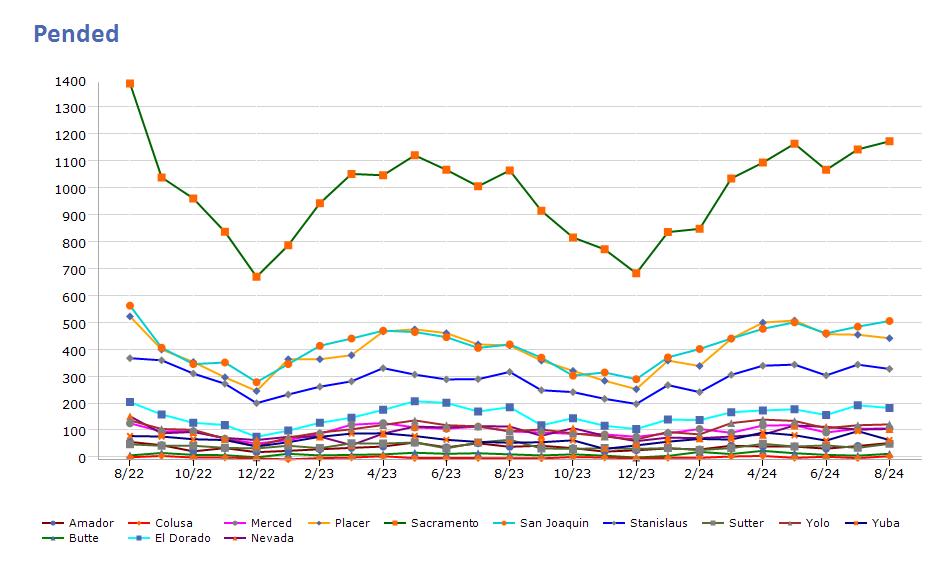 Powered by
 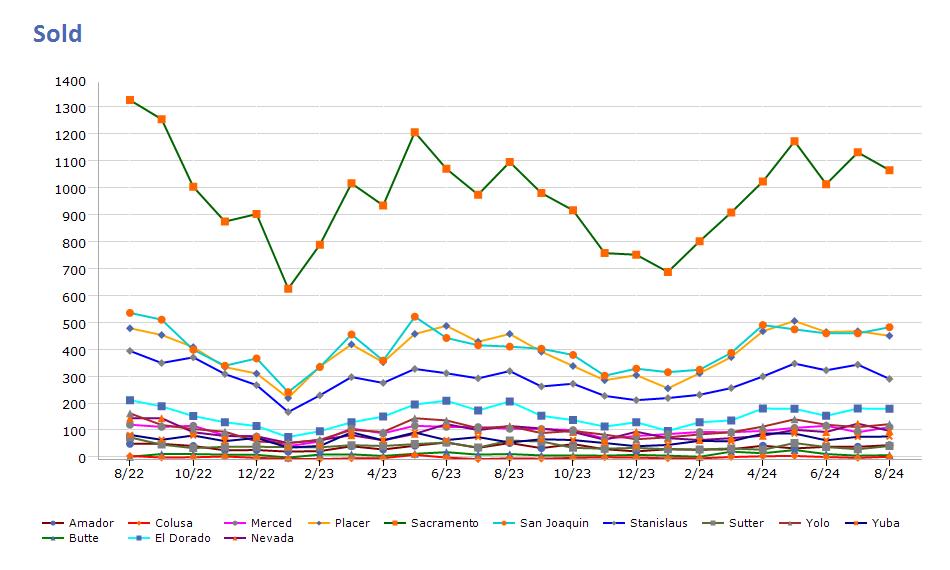 Powered by
 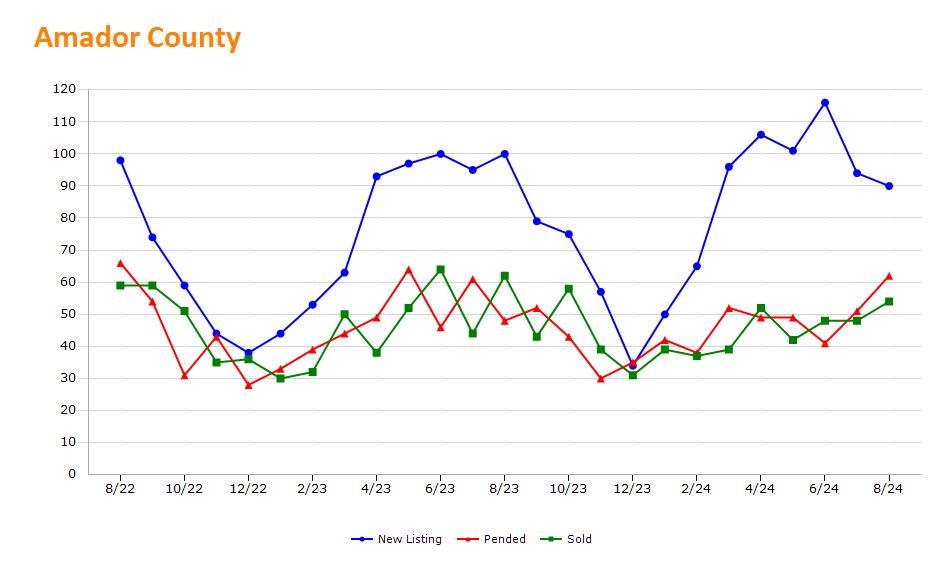 Powered by
 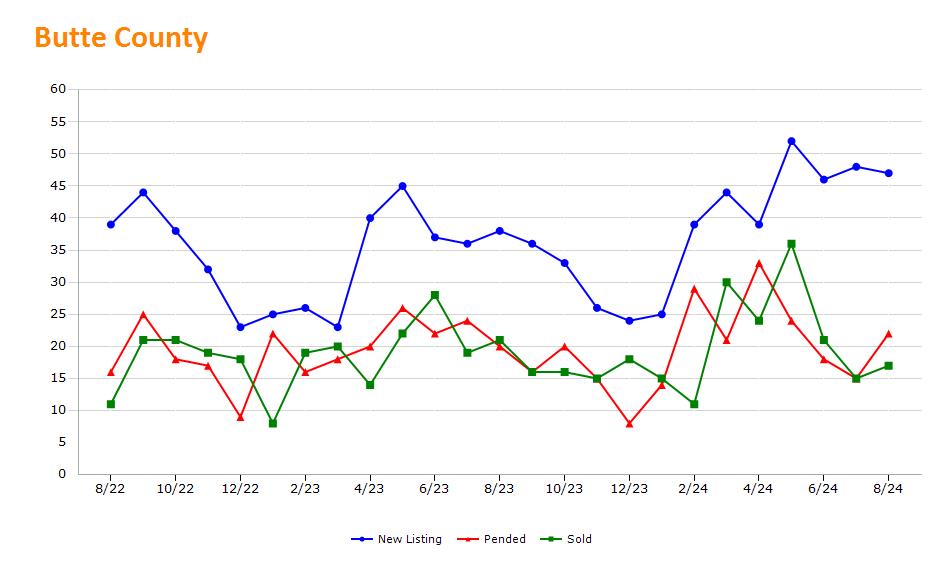 Powered by
 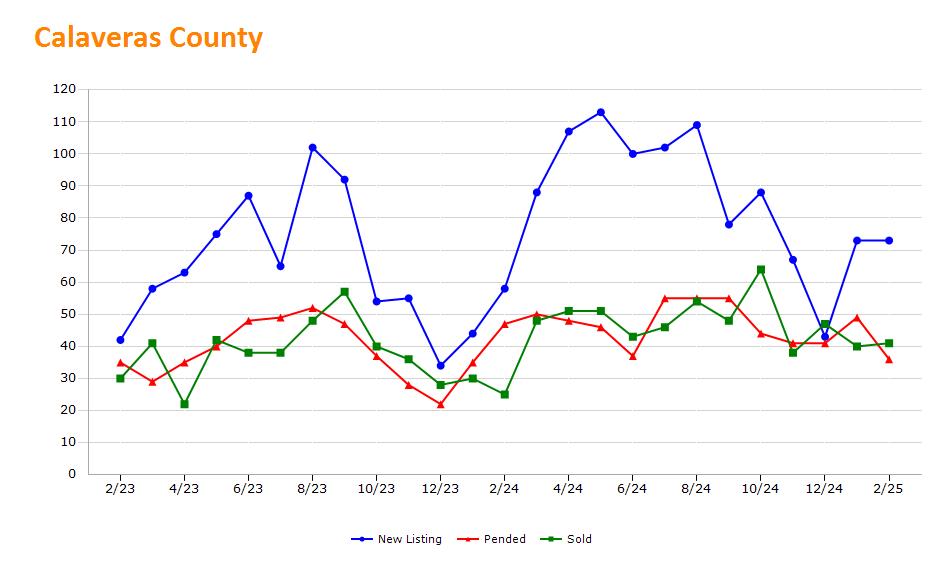 Powered by
 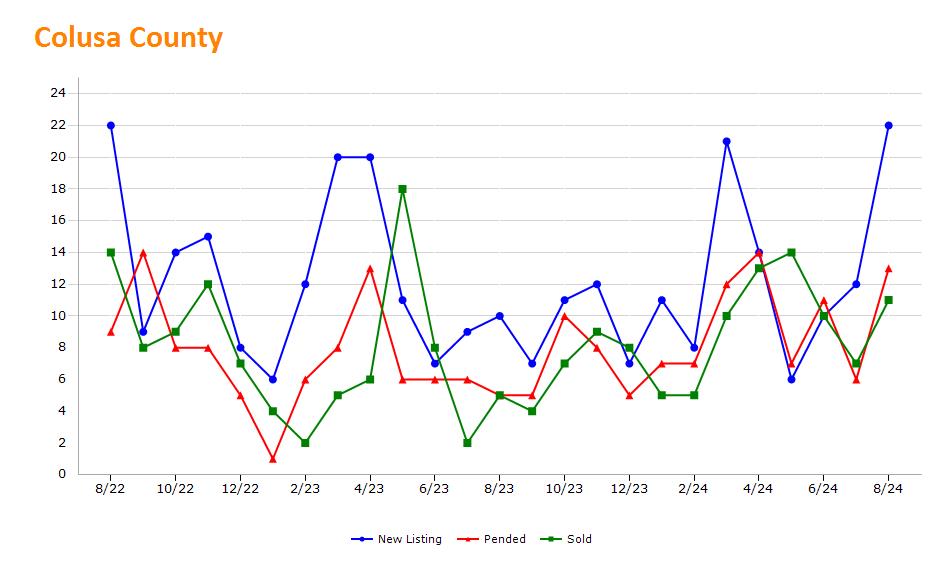 Powered by
 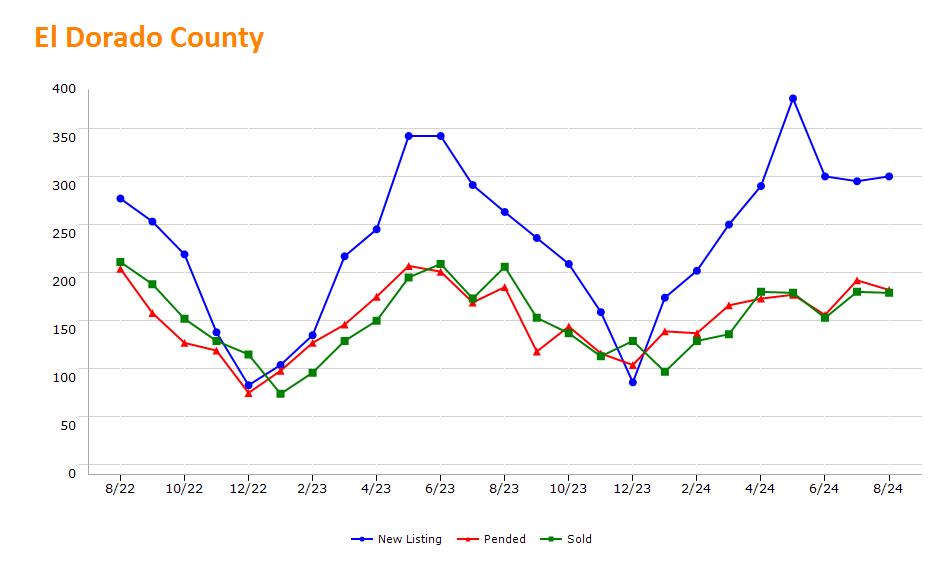 Powered by
 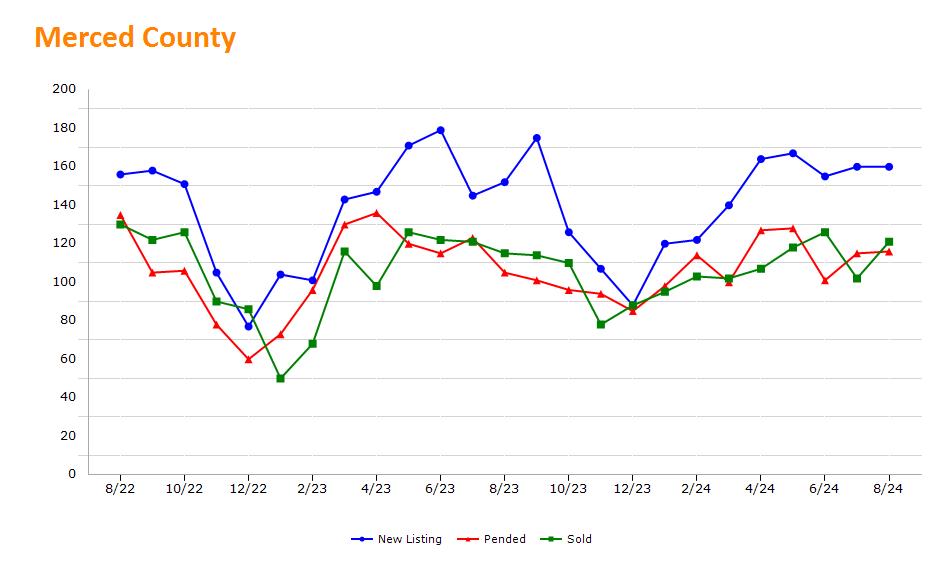 Powered by
 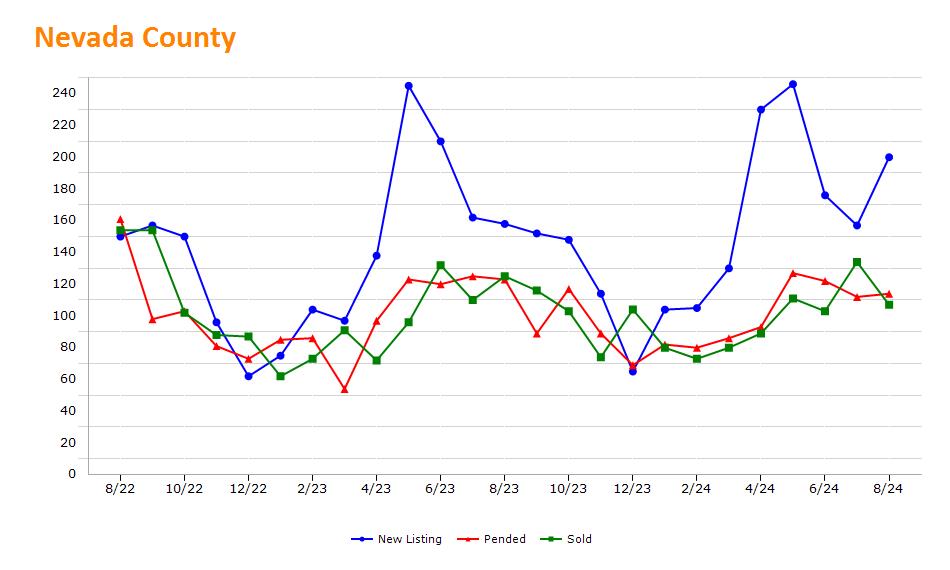 Powered by
 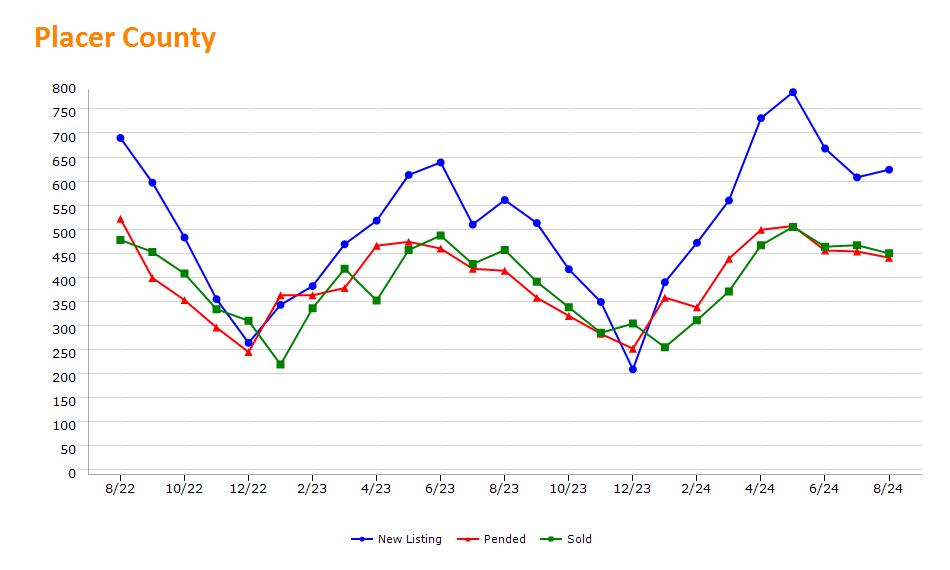 Powered by
 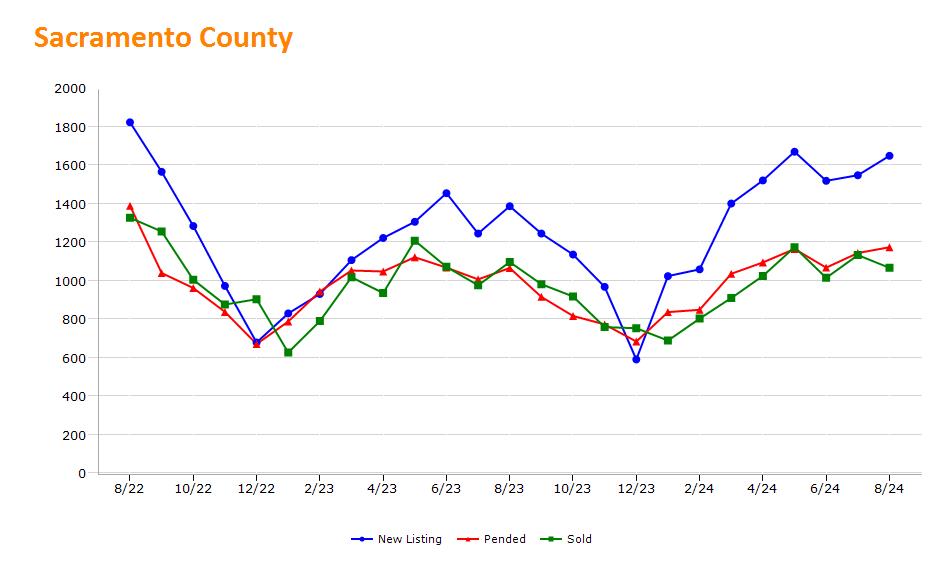 Powered by
 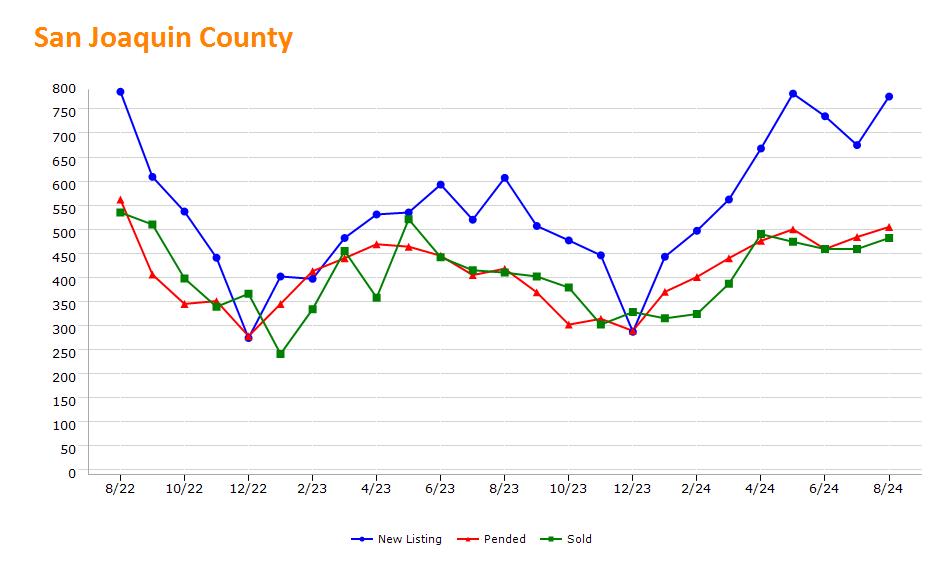 Powered by
 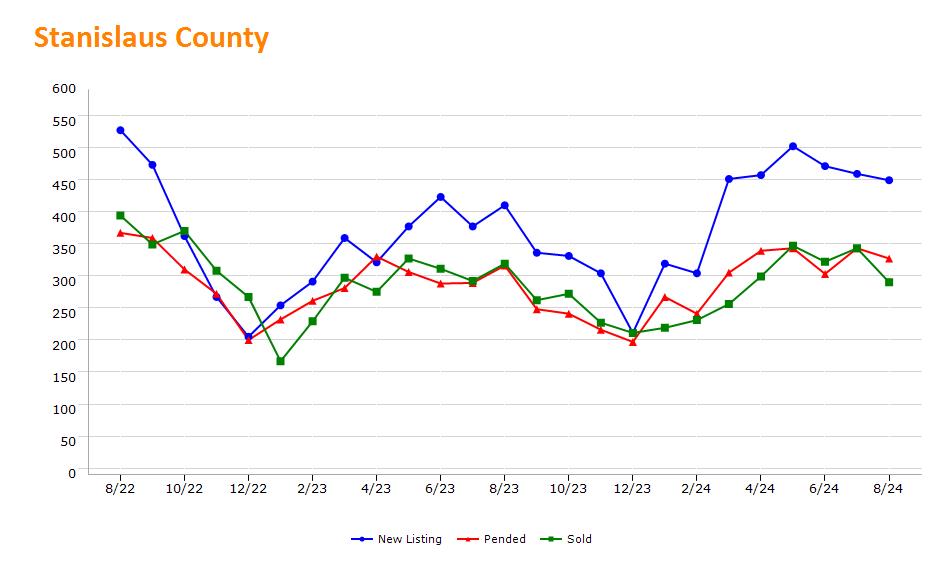 Powered by
 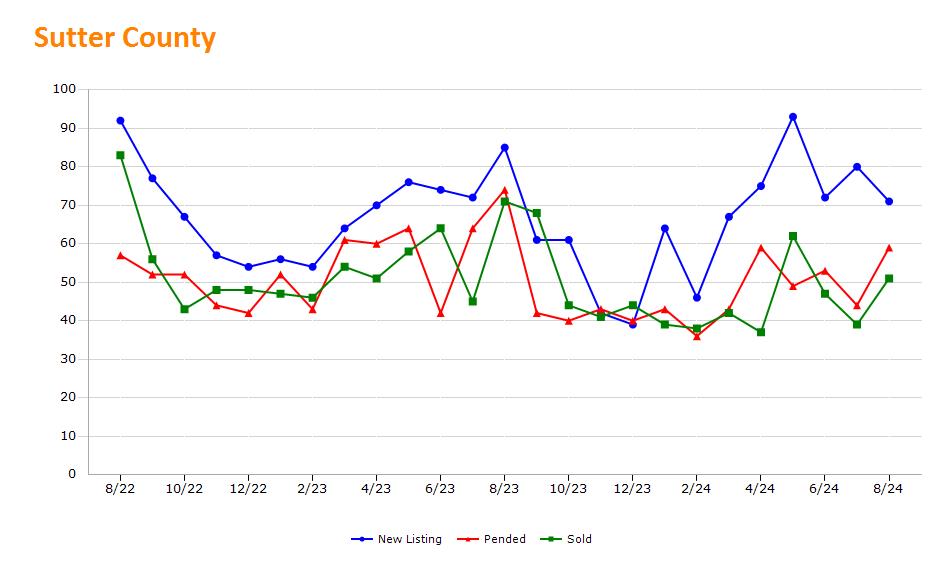 Powered by
 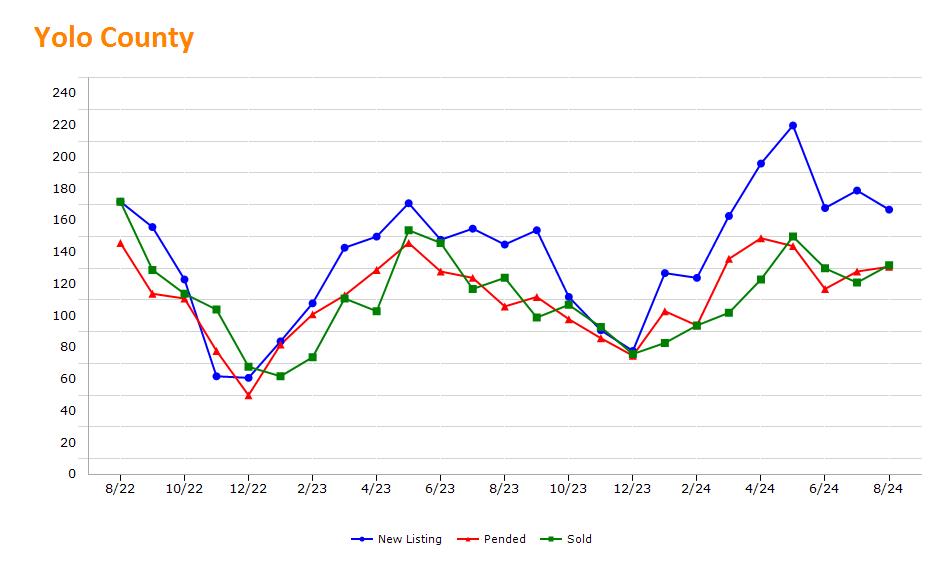 Powered by
 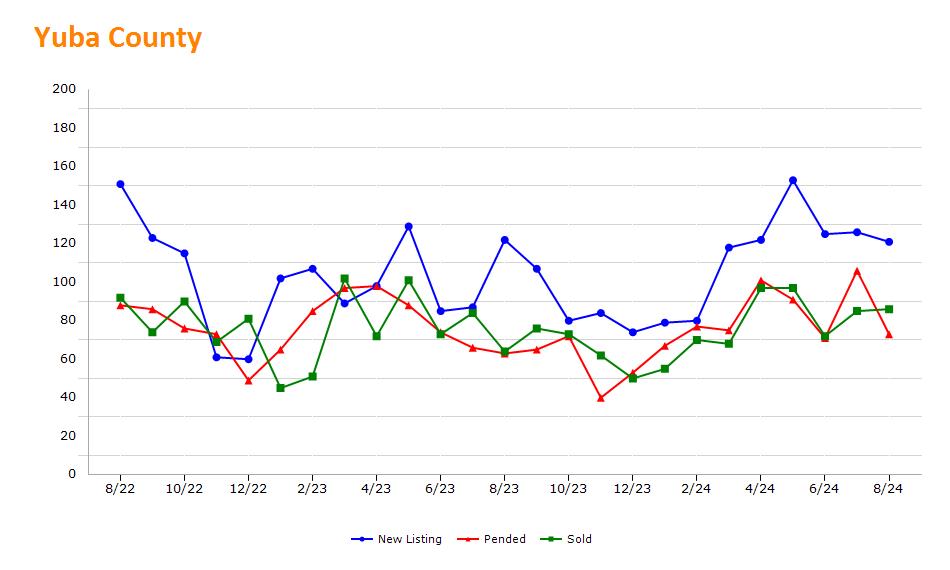 Powered by